|
|
|
|
|||||||||||||
|
Climb the Mountain Speech & Debate Foundation Climb the Mountain
provides support for coaches, students, and judges to build a bigger and even
better speech and debate community. |
Microsoft PowerPoint Advanced How tos . . . Prepared by Nick Griffin with Jim Hanson. Updated June 20, 2020. Written for PowerPoint 2010/2013 but
most of these suggestions work in the latest version of PowerPoint. Microsoft PowerPoint Advanced
How tos . . . How
to Theme Advanced for your PowerPoint (Slide Master) How
to make an Attention Getter Slide How
To Insert Picture Diagrams (SmartArt) How
To Insert Charts and Graphs How
To Make Transitions from One Slide to the Next How
To Make your Pictures and Bullets disappear How to
Theme Advanced for your PowerPoint
(Slide Master)
When you start with a blank PowerPoint, you have an
opportunity to create a look that will make your information clear and
engaging. Slide Master is a great place to start because it
creates a format that all your slides in the presentation will adopt. You
Start with this:
2. OPTION 1: Use Design Themes Note - Directly to the right of the themes you can also choose color,
font, and effects for your slide format to make it more customized.
3. OPTION 2: Use a Custom Background.
Here
are some examples of Custom Backgrounds. This is an example of a solid fill:
There
are multiple options for gradient fill as shown in this example:
Pattern and texture fills often
distract attention from your presentation and make some fonts hard to see so
use them with great care. 4. OPTION
3: Picture Background A. Go online and find a picture to save
as a possible background, or use a picture that you already have on your
computer. (Note: Pictures with resolution less than 600 x 400 typically don’t
look very good; you need a fairly decent quality picture.)
B. Right click your background à Click Format
Background à
Click on Picture fill à
File… à
find your picture and double click it/ok.
Make Your Picture Work. Your
picture hopefully looks cool but your text may not show up well in front of
it. So, you need to edit the picture so that your text can be seen. To do that, increase the transparency. A. Right Click the Picture
B. In this “Format Background” dialogue
box you can change the picture’s color, brightness, contrast, saturation or
give it other effects on the other tabs.
C.
To make text more visible, you can give it a shadow, make it bold or change
its color by clicking on the Drawing Tools à
Format tab in the top ribbon.
Note
you are probably still in the Slide Master view. To
exit on the ribbon, click Slide Master and there is a red icon “Close Master
View.”
How to make an Attention Getter Slide
Your PowerPoint presentation should always begin
with a strong attention getter. Note: You usually have a Title Slide
with your topic and your name before the Attention Getter Slide. You do not
show the Title Slide during your presentation; it is just like a “Title Page”
for a paper—for you and the professor, not for your presentation audience. A good attention getter usually does one of these
things to get people’s attention:
For example, if I am doing a presentation on
animals I could do something like this for a starting page:
Or If I was doing a presentation on parenting I
could do something satirical like this:
You could also use a short
engaging video for your attention getter. To do this, click the insert tab
on the ribbon, then click the video button, this will open the insert video
window allowing you to choose which video you want in your presentation.
If
you do decide to use a video as your attention getter be sure to say 1 to 2
sentences to introduce your video.
Remove a Picture Background
a. By
clicking “Mark Areas to Remove” the program turns the area that will be
deleted into the color pink. By clicking “Mark Areas to Keep” you can remove
areas of pink that you want to stay. b. As
you go along, there will be plus and minus circles which you can remove by
selecting them and clicking “Delete Mark.” c. If
you don’t like the changes you’ve made, click “Discard All Changes”, but if
you want to keep your changes click “Keep Changes”
6.
Finally there are the usual tools
that allow you to rotate, flip, crop, arrange, or give a border to your
image.
Remember you can click the white dots on the margin of the
picture to resize it or click the green dot to rotate it. NOTE: Use the corner dots (red circled above) to adjust the
photo; this will avoid skewing your images. This is an example of rotating or
flipping it.
How To Insert Picture Diagrams (SmartArt)
To
organize your information into flowcharts and clear diagrams, use SmartArt.
In the same Design ribbon click “Add
Shape” to add a new layer or shape with text (i.e. a circle in this case).
For example, if you are adding a new concept to a concept map or variable to
a ven diagram or box in a tree diagram.
Note:
You can go to the Smart Art Tools tab in the ribbon, click design, click the
text pane button, this will allow you to insert or edit the information in
your SmartArt.
And then you can either change the layout of the current
type of SmartArt, in this case a tree diagram or choose a completely new one
by clicking “More Layouts” which is highlighted in the picture below:
For example here I have made the tree diagram from above
into a funnel diagram:
Helpful
note: the white box on the side appears if you click the two arrows on the
SmarArt border as shown below in the red circle
How To Insert Charts and Graphs
Graphs and Charts make a great way to visualize
data and statistics to your audiences. To do this:
4. When
you choose the chart you want, it will open to an Excel window on the side.
5. You
can import data from an Excel or other document.
How To Edit Charts and Graphs
After you get the
Chart or Graph inserted, now it is time to edit it.
A. In the Design tab you can change the
chart type, edit the data, and change the chart layout and style. Note: you usually need to make changes
from the original graph by adding a title, labeling axis, and in general
making the data presentation effective. 1. Here is what it will look like right
after you input data:
2. However now it might be a good idea to “Switch Row
Column” to have a more effective data presentation especially for bar charts
(red above)
3. After the chart or graph looks suitable, you can edit
the layout.
4. Now you can see
where you can edit your title and axis just as you would any other text box
(red circles) B. In the Layout tab you
can change the chart labels, insert objects (picture, text box, shape), change the axes, adjust the
background, and play with your data in the spreadsheet.
C. In the Format tab,
you can change the shape and word art styles, arrange objects and change the
size of the graph or chart.
Here are some examples
of different styles and looks of graphs:
How To Make Transitions from One Slide to the Next
You
can make your PowerPoint move from one slide to the next with cool effects. 1.
Click Transitions in the top ribbon.
2.
Choose from a number of transitions between slides TIP: If you do the following to the Master Slide by
clicking on the top slide on the left
and add a transition, it will be applied to all slides. That way, you
don’t have to do this for each slide. a. When
you scroll your mouse over the transition you are interested in and pause, it
will give you a preview of what it will look like during the slide show. b. You
can also change the timing of the transition – generally it is good to have
them last no longer than 2 seconds. Note: 2 seconds is the automatic
duration time, but this can be changed by clicking the up down arrows on the
right of the duration button
c. Slides
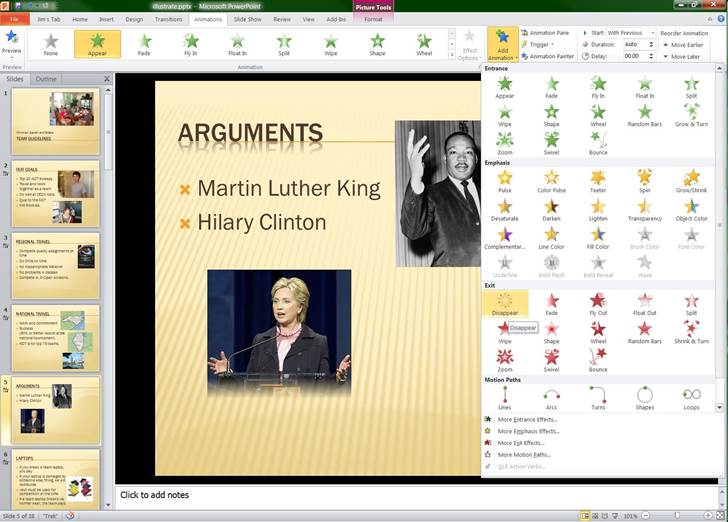
with a transition effect will have a little star icon to their left. How To Make your Pictures and Bullets
disappear
Sometimes, you want a picture to appear
and then disappear when you move on to your next point. Easy! 1.
Select the picture or bullet you want
to disappear. 2. On the Animations
tab, click Add Animations and
choose disappear (or other exit, red colored animation).
|
|
|||||||||||||
|
|
|
|
|||||||||||||